


If you want to discover structural weaknesses with your website’s layout, especially in terms of your call-to-action, conducting a focus group is one option. Focus groups have been popular in the past with marketers. However, they are expensive and time-consuming.
Presently, a better alternative is to use heat maps, which are more cost-efficient and quicker to implement. Plus, with heat maps, you don’t have to worry about participants modifying their behavior while being observed.
What Exactly Is A Heat Map?
Developed in 1991 by software designer Cormac Kinney, heat maps are “graphical representation[s] of data where the individual values contained in a matrix are represented as colors.”
The original purpose of heat maps was to display real-time financial market information to help traders make decisions. But in terms of web design and CRO, heat maps are used to track, quantify, and display visitors’ mouse and track pad movements in a way that’s visually appealing.
According to Christopher Jan Benitez, “Heat maps show how visitors interact with the information and graphic elements displayed on a webpage, and provide insight into how layout and user experience design impact users’ action and thereby conversion.”
The Benefits Of Using Heat Maps
Heat maps provide you with a wealth of information concerning your visitors’ web-browsing behaviors.
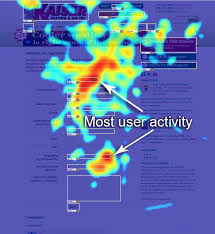
- They tell you what areas your visitors pay the most attention to.
- They tell you how your visitors interact with your call-to-action.
- And they tell you whether or not obvious friction points exist—for example, elements on your site that appear clickable but are actually static.
Heat maps and the data they offer are your guides to improving the user experience.

“You can use heat maps to gather data from a large sample of users, without leaving the comfort of your office chair.
The data is more accurate, representing a large set of users that are most likely to be your ideal clients or customers who are interacting with your website in their ‘natural’ environment.
The data gathered can inform the design and development of your website, so you can adjust the graphic layout and user experience to increase conversion.”
How To Use Heat Maps To Increase Your Conversion Rates
Armed with heat map data, you’re able to discover if visitors are using your website as you intended. Then, you can make any necessary tweaks to increase your conversion rates. Here’s a list of things that heat maps can help you accomplish.
1. Discover The Effectiveness Of Your Call-To-Action And Optimize Its Placement
Heat maps reveal precisely where visitors click on your webpage. This means they can also tell you whether or not your visitors are following your CTA’s directive.
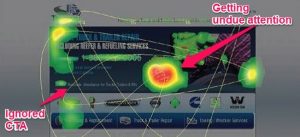
Additionally, heat maps track eye movements, which is useful information because you can use it to identify the areas commanding your visitors’ attention. Then, you can streamline your page design by placing your CTA where your visitors’ eyes tend to gravitate so your CTA doesn’t get ignored.
2. Reduce Shopping Cart Abandonment
If visitors aren’t converting on your checkout page, heat map data can show you where they’re clicking instead. Perhaps they’re mousing all over the page because the checkout button isn’t apparent. Or maybe they’re getting distracted by a promotional banner, which was the case on The North Face website.

“The North Face saw that many users didn’t pay attention to the checkout button on the shopping cart page. Instead, they were focused on the promotional banner above the button, which invited everybody to become a rewards member,” reports Sezgin Hergul.
3. Identify Dead Weights On Your Webpage
Are there any elements that visitors consistently ignore or overlook? If so, a heat map will let you know. Then, you can make a more informed decision about keeping, scrapping, or relocating that element.
What are your thoughts on heat maps? Have you used them before? How did you use their data to improve your conversion rates?